
A financial report is useful only when the reader can answer three questions: What changed? Why did it change? What needs attention next?
Pages of numbers without definitions, comparisons, or context do not provide that clarity. This free financial report template for Microsoft Word helps small businesses, departments, nonprofits, projects, and internal management teams present financial information in a consistent narrative. Use it alongside verified accounting records—not instead of a general ledger, accounting system, statutory statements, tax filings, or professional review.
The template can be tailored for a monthly financial report, quarterly review, annual management report, budget update, board pack, project finance summary, or grant report. The sections you need will depend on the audience and the reporting framework that applies.
Know the Report’s Audience
A department manager needs different detail from a lender, investor, board member, donor, regulator, or tax authority. Before choosing tables and charts, define:
- Who will read the report
- What decision they need to make
- Which period is covered
- Whether figures are actual, forecast, budgeted, or unaudited
- Which accounting basis and currency are used
- What level of detail is appropriate
- When the report must be delivered
An internal monthly report may emphasize budget variance and cash runway. An annual external report may need formal financial statements, disclosures, comparatives, governance information, and independent assurance. Do not label an informal management summary “audited” or “compliant” unless it genuinely meets the applicable requirements.
Build a Reliable Reporting Pack
A practical financial report often combines a short narrative with financial statements, supporting schedules, and notes.
Executive Summary
Summarize the period’s financial position, performance, cash movement, major variances, unusual items, risks, and recommended actions. Write it after the analysis is complete. The summary should not introduce numbers that readers cannot trace to the report.
Income Statement or Statement of Activities
This section shows revenue or income, expenses, and the resulting profit, loss, surplus, or deficit for a period. Present current-period results beside budget and a relevant prior period where useful.
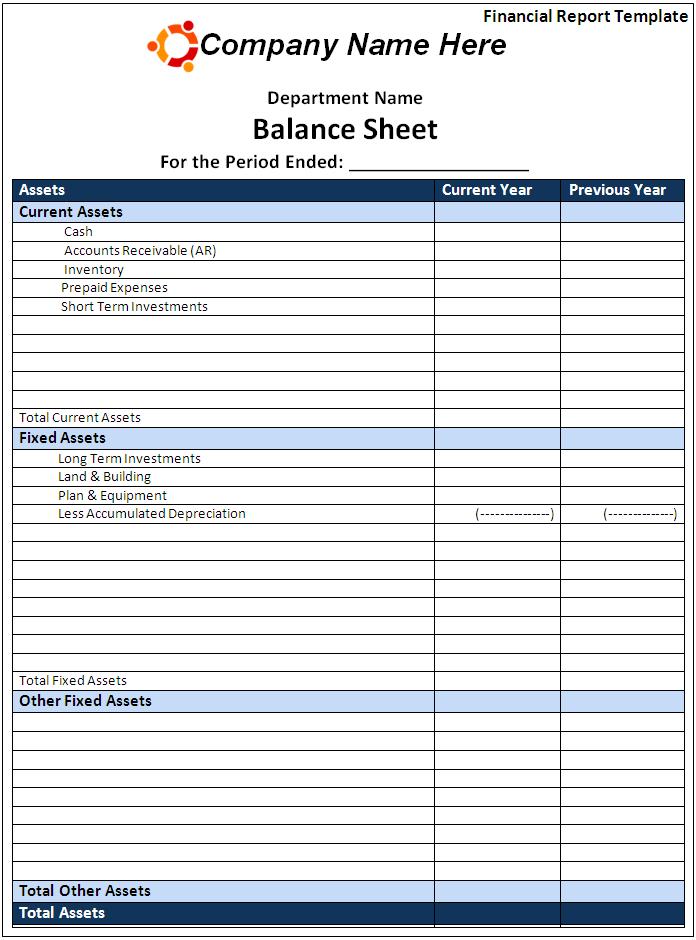
Balance Sheet or Statement of Financial Position
This is a point-in-time view of assets, liabilities, and equity or net assets. It helps readers understand liquidity, debt, working capital, and accumulated financial position.
Cash Flow Information
Cash flow explains changes in cash from operating, investing, and financing activities. A profitable organization can still face a cash shortage if customers pay slowly, inventory grows, debt is repaid, or capital spending is high.
Budget-to-Actual Comparison
Show the budget, actual result, absolute variance, percentage variance, and explanation. Focus management commentary on material, actionable differences.
Forecast
Update the expected full-year or project outcome based on current evidence. Separate the original budget from the latest forecast so readers can see both the approved plan and the current expectation.
Notes and Supporting Schedules
Explain accounting policies, assumptions, commitments, contingencies, unusual transactions, restricted funds, debt, aging, inventory, capital expenditure, or other items necessary to understand the figures.
Start With Clean, Reconciled Data
Good writing cannot repair unreliable numbers. Before preparing the report:
- Post transactions for the period
- Reconcile bank and cash accounts
- Review accounts receivable and payable
- Record payroll, tax, debt, and card activity
- Review inventory and fixed assets where relevant
- Record accruals, prepayments, depreciation, and adjustments as required
- Confirm opening balances and prior-period comparatives
- Investigate suspense, duplicate, or unusual entries
- Lock or control the reporting version after review
Use an agreed close checklist with named owners and deadlines. Mark estimates and pending adjustments rather than allowing provisional figures to appear final.
Use the Right Accounting Basis
Cash-basis reporting generally recognizes activity when money moves. Accrual-basis reporting generally recognizes revenue when earned and expenses when incurred, subject to the applicable rules. The difference can materially affect reported performance and financial position.
State the basis used. Do not mix cash and accrual figures without explanation. Formal reporting may be governed by local law, tax rules, contractual requirements, GAAP, IFRS, public-sector standards, nonprofit rules, or another framework. A general Word template cannot determine which framework applies.
Explain Revenue Carefully
Revenue growth can look positive while concealing concentration, low margins, slow collections, returns, discounts, or one-time sales. Break down revenue by a meaningful dimension:
- Product or service line
- Customer type
- Geography
- Channel
- Program or funding source
- Recurring and nonrecurring activity
Explain what drove the change: volume, price, mix, timing, new customers, contract changes, seasonality, foreign exchange, or recognition policy. Avoid attributing growth to a campaign without evidence that supports the connection.
Analyze Expenses Beyond “Over Budget”
Separate fixed, variable, discretionary, and one-time costs where that improves understanding. A higher expense is not automatically bad; it may support greater output, comply with a requirement, prevent a larger loss, or reflect timing.
A useful variance explanation states:
- What changed
- How much it changed
- Why it changed
- Whether the effect is temporary or ongoing
- What action is proposed
“Travel was unfavorable” says little. “Travel exceeded the quarter budget by $8,400 because two customer installations moved forward from the next quarter; the full-year forecast is unchanged” is decision-ready.
Profit Is Not Cash
This distinction deserves its own section in almost every small-business financial guide. Profit includes recognized revenue and expenses. Cash depends on when money is collected and paid.
A company may report profit but run short of cash because:
- Customers have not paid invoices
- Inventory was purchased in advance
- Equipment was bought
- Loans or taxes were paid
- Deposits or deferred revenue changed
- Owner distributions or dividends were made
Conversely, cash may rise because of borrowing or customer deposits even though the period is unprofitable. Explain the bridge between reported performance and cash movement.
Working Capital Signals
Track receivables, payables, inventory, and other short-term balances. Useful views include receivable aging, overdue balances, days to collect, inventory movement, supplier-payment timing, and current obligations.
Ratios can help but need context. Common examples include:
- Current ratio: Current assets ÷ current liabilities
- Quick ratio: Liquid current assets ÷ current liabilities
- Gross margin: (Revenue − direct cost) ÷ revenue
- Operating margin: Operating result ÷ revenue
- Debt-to-equity: Debt ÷ equity
Definitions differ across industries and organizations. Label the exact formula, use consistent periods, and avoid treating a benchmark as universally good or bad.
Cash Forecasting and Runway
A short-term cash forecast estimates receipts, payroll, suppliers, tax, debt service, capital purchases, and other payments by week or month. Use realistic collection dates rather than invoice due dates alone. Separate committed payments from discretionary spending.
Scenario planning is valuable when timing is uncertain. A downside case might assume slower customer receipts, lower sales, higher costs, or delayed funding. Show when cash reaches a management threshold and which actions would be available.
Budget Variance Without Blame
A variance report should improve decisions, not punish people for every difference. Some variances reflect bad assumptions, some reflect timing, and some reflect deliberate choices.
Establish a materiality rule so commentary focuses on meaningful items—for example, a monetary threshold, percentage threshold, or risk-based criterion. Small differences may be aggregated unless they indicate fraud, compliance failure, control weakness, or a repeating pattern.
Forecasting With Honesty
A forecast is a current estimate, not a promise. Document key assumptions such as prices, sales volume, staffing, exchange rates, inflation, project dates, collection patterns, grants, and supplier terms.
Use scenario or sensitivity analysis for influential assumptions. Readers should be able to see how results change if sales are lower, hiring is delayed, costs rise, or a contract ends. Avoid improving the forecast merely to close a budget gap without operational evidence.
Nonprofit and Restricted-Fund Reporting
Nonprofits may need to distinguish restricted and unrestricted resources, grant periods, program and administrative spending, donor conditions, and reporting obligations. A favorable overall cash balance may not mean funds are available for every purpose.
Use the terminology and classifications required by the relevant accounting framework, grant agreement, regulator, and governing body. Do not reclassify restricted money for convenience.
Controls and Review
Financial reports often contain confidential information and influence significant decisions. Apply appropriate controls:
- Limit access to authorized people
- Separate preparation, approval, and payment duties where possible
- Keep source data and calculation trails
- Review formulas and linked figures
- Use version control
- Protect files in transit and storage
- Document adjustments and approvals
- Retain records according to applicable policy and law
Small teams may not achieve complete segregation of duties. Compensating controls—such as owner review, bank alerts, independent reconciliation, and board oversight—may reduce risk.
Charts That Clarify Rather Than Decorate
Use charts for trends, composition, and comparison. A line chart can show monthly revenue or cash; a bar chart can compare budget and actual; a stacked chart can show cost mix. Always label units and periods.
Avoid truncated axes that exaggerate differences, 3D effects that distort values, and too many categories. Include the underlying numbers when precision matters. Choose colors with sufficient contrast and do not rely on color alone to communicate meaning.
Write a Strong Management Commentary
Each major section should connect numbers with operations. A concise commentary can follow this sequence:
- Result: what happened
- Driver: why it happened
- Outlook: whether it will continue
- Action: what management will do
- Risk: what could change the conclusion
Be consistent about favorable and unfavorable news. Do not explain negative variances in detail while attributing positive results vaguely to management skill.
Final Quality Check
Before distribution, confirm that totals add, statement relationships reconcile, dates match, units are consistent, and comparatives use the same basis. Trace headline numbers to supporting schedules. Check that charts agree with tables and that narrative claims agree with the figures.
Label drafts, unaudited information, estimates, and forecasts clearly. Remove comments, hidden text, tracked changes, and unrelated confidential data from the final file.
Customize the Template
Save an original copy, then add your organization, reporting period, currency, accounting basis, audience, preparer, and approval date. Insert only the statements, tables, charts, and narrative sections needed for the decision. Link each figure to a controlled source and create a preparation checklist for repeated reporting.
This general template is not accounting, investment, tax, audit, or legal advice. Financial statements and regulated reports may require specific formats, disclosures, signatures, assurance, or filing methods. Consult qualified professionals and current official requirements.
Download Your Financial Report Template
Preview the editable report layout below and download the Microsoft Word file. Customize the document, verify every figure against approved records, and protect confidential information.

Financial Report FAQs
What should a financial report include?
The contents depend on the audience, but common elements include an executive summary, income statement, balance sheet, cash flow, budget comparison, forecast, notes, and management commentary.
How often should financial reports be prepared?
Many organizations report monthly, quarterly, and annually. Cash-sensitive or rapidly changing operations may need weekly dashboards or cash forecasts.
What is the difference between profit and cash flow?
Profit measures recognized revenue less expenses under the chosen accounting basis. Cash flow records actual cash movement, which is affected by timing, borrowing, capital purchases, and working capital.
Should reports compare actual results with budget?
Usually yes. Comparisons help readers identify material differences, understand causes, and update decisions or forecasts.
Can I use Word instead of accounting software?
Use Word to present and explain verified information. It should not replace transaction records, reconciliation, controls, or accounting software where those are needed.
What does “unaudited” mean?
It indicates that the information has not been subject to an independent audit. Do not imply assurance that has not been performed.
How do I explain a variance?
State the amount, cause, timing, expected future effect, and planned action. Focus on material and decision-relevant differences.
Which accounting standard should I use?
That depends on jurisdiction, entity type, contracts, regulators, and report purpose. Ask a qualified accountant and consult current official requirements.
How should confidential financial reports be shared?
Restrict access, use approved secure storage and delivery methods, control versions, and avoid including unnecessary personal or banking data.
Is this financial report template free?
Yes. Download and customize it for legitimate internal or organizational reporting, subject to any professional and regulatory requirements that apply.